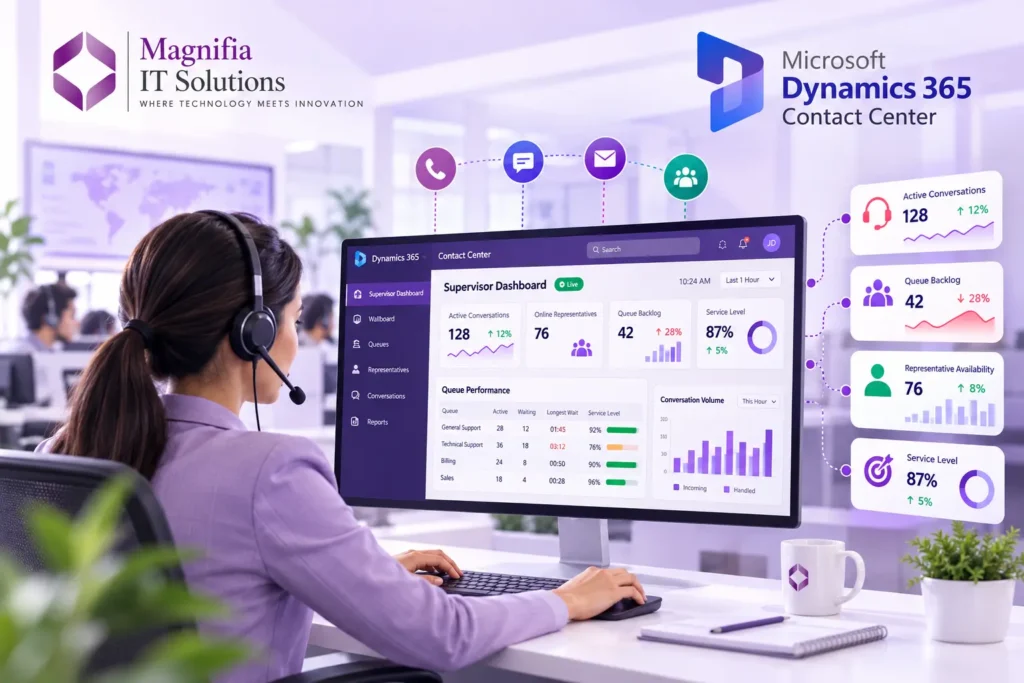
Customer service teams increasingly need to respond to customer issues as they happen—not hours later when reports become available. To help contact center supervisors make faster operational decisions, Microsoft has introduced real-time streaming analytics and enhanced supervisor experiences in Dynamics 365 Contact Center, now available as a production-ready public preview.
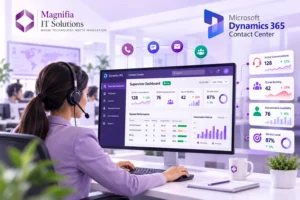
The new capabilities provide supervisors with a live view of contact center operations, including active conversations, queue backlogs, representative availability, service levels, wait times, abandon rates, and other critical performance indicators.
Instead of relying only on historical reports, supervisors can now monitor what is happening across their contact center, identify emerging problems, and take action while customer interactions are still in progress.
For organizations using Microsoft Dynamics 365 to modernize customer service operations, this update represents an important step toward more responsive, data-driven contact center management.
What Is New in Dynamics 365 Contact Center?
Microsoft’s new real-time streaming analytics experience is designed specifically around the needs of contact center supervisors.
The experience combines live operational visibility with analytics and action-oriented capabilities. Supervisors can monitor the overall health of the contact center, investigate performance changes, identify queues under pressure, and manage conversations or representative assignments when intervention is required.
Microsoft describes the new experience as an event-driven foundation that provides supervisors with a current view of operational activity.
The new supervisor experience includes several key views:
- Wallboard
- Assisted Service
- Queues
- Representatives
- Conversations
Together, these views allow supervisors to move from monitoring to investigation and finally to action.
Why Real-Time Visibility Matters for Contact Centers
Traditional contact center reporting remains valuable for analyzing historical performance and identifying long-term trends. However, historical information does not always help supervisors solve an issue that is happening right now.
Imagine a contact center experiencing a sudden increase in customer conversations.
A supervisor may need to answer several questions immediately:
- How many conversations are currently active?
- How many customers are waiting?
- Which queue has the largest backlog?
- How long has the longest-waiting customer been waiting?
- How many representatives are available?
- Is the service level deteriorating?
- Are customers abandoning conversations?
- Should representatives be moved between queues?
Real-time analytics can help answer these questions without requiring supervisors to wait for scheduled reports.
This reduces the gap between identifying an operational problem and taking action.
Microsoft’s documentation explains that real-time streaming analytics uses an event-driven architecture to provide live metric updates, helping supervisors respond faster to operational issues and make better staffing decisions.
1. Live Wallboards Give Supervisors an Instant Operational View
The new Wallboard experience provides a consolidated view of contact center health.
Supervisors can use the wallboard to monitor important operational indicators from a single screen.
Key information includes:
- Active conversations
- Online representatives
- Representative presence
- Queue backlog
- Current longest wait time
- Service level
- Abandon rate
- Average speed to answer
This gives supervisors a quick understanding of whether the contact center is operating normally or whether immediate attention is required.
For example, if the number of active conversations suddenly increases while representative availability decreases, the supervisor can quickly identify the developing capacity problem.
The wallboard also supports filters such as period, channel, and queue, allowing supervisors to narrow the information they need to investigate.
2. Live Metrics vs. Aggregated Metrics
One important aspect of the new experience is the distinction between live and aggregated metrics.
Live metrics
Live metrics represent the current operational state of the contact center.
Examples include:
- Active conversations
- Queue backlog
- Online representatives
- Longest wait time
These metrics help supervisors understand what is happening right now.
Aggregated metrics
Aggregated metrics summarize performance over a selected period.
Examples include:
- Service level
- Abandon rate
- Average speed to answer
This distinction is important because supervisors need both perspectives.
Live metrics answer:
“What is happening now?”
Aggregated metrics help answer:
“How are we performing over this period?”
By combining both, supervisors can understand the current situation while also considering recent performance trends.
3. Identify At-Risk and Critical Performance
Another useful capability is the use of thresholds and visual indicators.
Metrics can be categorized into three operational states:
Normal – Performance is within the expected range.
At Risk – The metric is approaching a critical level.
Critical – The metric has moved outside the acceptable range.
This allows supervisors to prioritize their attention instead of manually reviewing every number.
For example, if a queue’s wait time or abandon rate reaches a critical threshold, the supervisor can immediately focus on that queue rather than reviewing the entire contact center.
Microsoft Learn documents these threshold states as part of the real-time streaming analytics experience.
4. Queue-Level Analytics Help Find Operational Bottlenecks
The Queues view provides a more detailed understanding of where pressure is building.
Supervisors can review queue-level metrics such as:
- Queue backlog
- Current longest wait time
- Abandon rate
- Average speed to answer
- Service level
- Representative availability
- Transfers
- Overflows
- Callbacks
This is particularly useful for organizations managing multiple teams, departments, products, or customer service queues.
Instead of simply knowing that overall contact center performance is declining, supervisors can identify which specific queue is responsible for the change.
For example, an organization might have separate queues for:
- Sales
- Billing
- Technical Support
- Premium Customers
- General Customer Service
If technical support suddenly experiences increased demand, supervisors can identify the queue and respond before the issue significantly affects customers.
Microsoft’s current documentation confirms that the Queues view provides queue-level operational visibility and supports filtering by period, channel, and queue.
5. Better Visibility Into Representative Availability
The Representatives view helps supervisors understand workforce availability and workload.
Supervisors can review information such as:
- Representative availability
- Presence status
- Active conversations
- Answered versus offered assignments
- Unanswered assignments
- Presence duration
- Capacity
This information can help identify representatives who are overloaded as well as available capacity that could be used elsewhere.
For example, if one queue is experiencing a significant backlog while another group has available representatives with the appropriate skills, supervisors can rebalance resources.
Microsoft’s announcement also describes capabilities that allow supervisors to update queue memberships and representative presence when operational conditions require intervention.
6. Manage Conversations Without Leaving the Analytics Experience
The new experience is not limited to displaying charts and metrics.
The Conversations view provides visibility into ongoing, queued, and completed customer conversations.
Depending on the operational situation, supervisors can take actions such as:
- Assigning conversations
- Transferring conversations
- Force-closing conversations
- Reviewing conversations by queue
This creates a more direct connection between insight and action.
A supervisor does not simply discover that a queue is overloaded. They can investigate the problem and take operational steps to help address it.
This is an important shift from traditional dashboards, where analytics and operational actions are often separated across different screens or systems.
7. How Real-Time Analytics Can Improve Customer Experience
The primary business value of real-time analytics is not simply better dashboards.
The bigger objective is helping organizations respond faster.
Consider a situation where customer demand suddenly increases.
Without real-time visibility, a supervisor may only discover the problem after service levels have already deteriorated.
With live operational information, the supervisor can potentially:
- Detect the increase in demand.
- Identify the affected queue.
- Check representative availability.
- Identify available capacity.
- Adjust queue assignments or presence.
- Monitor whether the situation improves.
This creates a faster operational feedback loop.
For businesses, that can translate into:
- Faster response times
- Reduced customer waiting
- Better workforce utilization
- Earlier detection of service-level problems
- More proactive contact center management
- Improved customer experience
Microsoft specifically positions the new capabilities around reducing the distance between operational signals and action.
8. What Organizations Need to Get Started
Organizations interested in using real-time streaming analytics need to meet the required Dynamics 365 Contact Center configuration.
Microsoft currently lists requirements including:
- Omnichannel for Contact Center must be configured and in use.
- Users need the appropriate Omnichannel Supervisor role.
- Customer interaction channels such as voice, chat, or asynchronous messaging need to be configured and generating live interaction data.
The feature is currently described by Microsoft as a production-ready public preview, meaning organizations can evaluate the capability while it remains subject to preview terms and potential changes.
Organizations should therefore evaluate the capability in the context of their existing Dynamics 365 architecture, security model, customer-service processes, and compliance requirements.
9. What This Means for the Future of Contact Center Management
The introduction of real-time streaming analytics is part of a broader movement toward intelligent and increasingly automated customer service.
Contact centers are evolving from systems that simply record customer interactions into platforms that can continuously analyze operational conditions and help teams respond.
The combination of:
Real-time data + AI + automation + human supervision
can create a more proactive customer service model.
Instead of waiting for end-of-day reports, managers can identify emerging issues during the customer interaction itself.
This direction also aligns with Microsoft’s broader Dynamics 365 Contact Center strategy, which includes AI, automation, Copilot capabilities, intelligent interaction management, and agentic experiences.
10. What Businesses Should Consider Before Adoption
Real-time analytics can provide significant operational value, but organizations should approach implementation strategically.
Before deploying the capability broadly, businesses should consider:
Define the right KPIs
Not every metric needs to be monitored continuously.
Organizations should identify the KPIs that genuinely influence customer experience and operational performance.
Establish escalation thresholds
Teams should define what constitutes normal, at-risk, and critical performance for their business.
Review workforce processes
Real-time visibility is most valuable when supervisors have clear processes for responding to problems.
Consider security and compliance
Contact center analytics can involve employee and customer interaction data. Organizations should review applicable privacy, monitoring, recording, and data-retention requirements.
Microsoft specifically notes that customers are responsible for complying with applicable laws and appropriately informing users when communications may be monitored, recorded, or stored.
Start with a focused implementation
Rather than changing every process at once, organizations can begin with high-volume queues or critical customer-service operations and measure the impact.
Dynamics 365 Contact Center Real-Time Analytics: A Step Toward Smarter Operations
Microsoft’s new real-time streaming analytics capabilities give contact center supervisors a more immediate view of operational performance.
The combination of live wallboards, queue analytics, representative visibility, conversation management, thresholds, and real-time metrics can help organizations move from reactive reporting to proactive operational management.
For businesses already using Dynamics 365 Contact Center, this preview is worth evaluating as part of their customer-service modernization roadmap.
For organizations still relying on disconnected contact center tools and delayed reporting, it also highlights the broader opportunity to bring customer service, analytics, AI, automation, and workforce operations together on a unified platform.
At Magnifia IT Solutions, we help businesses evaluate and modernize their Microsoft Dynamics 365 environments, from implementation and customization to integrations, automation, analytics, and ongoing optimization.
If your organization is planning to modernize its customer service operations, Dynamics 365 Contact Center and its emerging real-time capabilities can be an important part of that transformation.
Frequently Asked Questions
What is Dynamics 365 Contact Center?
Dynamics 365 Contact Center is Microsoft’s cloud-based contact center solution designed to help organizations manage customer interactions across channels while using analytics, AI, automation, and customer-service capabilities.
What are Dynamics 365 Contact Center Supervisor Dashboards?
The new supervisor experience provides real-time operational visibility into areas such as active conversations, queue backlog, representative availability, service levels, wait times, and other contact center metrics.
Is real-time streaming analytics available in Dynamics 365 Contact Center?
Yes. Microsoft currently describes real-time streaming analytics as a production-ready public preview capability for Dynamics 365 Contact Center.
What can supervisors monitor?
Supervisors can monitor active conversations, online representatives, representative presence, queue backlog, longest wait time, service level, abandon rate, and average speed to answer through the Wallboard experience.
Can supervisors take action from the new dashboards?
Yes. Depending on the view and scenario, supervisors can perform operational actions such as updating queue assignments, changing representative presence, and managing conversations.
Is Dynamics 365 Contact Center suitable for large customer service teams?
The platform is designed for modern contact center operations and provides capabilities for monitoring queues, representatives, conversations, analytics, AI, and automation. Suitability depends on an organization’s requirements, channels, architecture, scale, and implementation strategy.
Final Thoughts
The introduction of live supervisor dashboards and real-time streaming analytics marks another step in the evolution of Dynamics 365 Contact Center.
For modern customer service teams, knowing what happened yesterday is valuable—but knowing what is happening right now can be even more important.
With real-time operational visibility, supervisors can identify problems earlier, understand where pressure is building, and take action before small issues become significant customer experience problems.
As Microsoft continues expanding AI, automation, and intelligent contact center capabilities, real-time analytics could become an increasingly important foundation for proactive customer service operations.